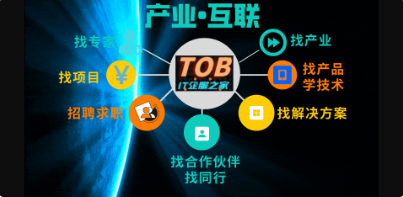
Kubernetes监控手册05-监控Kubelet

打印 上一主题 下一主题

主题 593|帖子 593|积分 1779

上一篇我们介绍了如何监控Kube-Proxy,Kube-Proxy的/metrics接口没有认证,相对比较容易,这一篇我们介绍一下Kubelet,Kubelet的监控相比Kube-Proxy增加了认证机制,相对更复杂一些。
Kubelet 端口说明

如果你有多台Node节点,可以批量执行 ss -tlnp|grep kubelet 看一下,Kubelet 监听两个固定端口(我的环境,你的环境可能不同),一个是10248,一个是10250,通过下面的命令可以知道,10248是健康检查的端口:
  1. [root@tt-fc-dev01.nj ~]# ps aux|grep kubelet
  2. root      163490  0.0  0.0  12136  1064 pts/1    S+   13:34   0:00 grep --color=auto kubelet
  3. root      166673  3.2  1.0 3517060 81336 ?       Ssl  Aug16 4176:52 /usr/bin/kubelet --bootstrap-kubeconfig=/etc/kubernetes/bootstrap-kubelet.conf --kubeconfig=/etc/kubernetes/kubelet.conf --config=/var/lib/kubelet/config.yaml --hostname-override=10.206.0.16 --network-plugin=cni --pod-infra-container-image=registry.aliyuncs.com/google_containers/pause:3.6
  4. [root@tt-fc-dev01.nj ~]# cat /var/lib/kubelet/config.yaml | grep 102
  5. healthzPort: 10248
  6. [root@tt-fc-dev01.nj ~]# curl localhost:10248/healthz
  7. ok
复制代码
我们再看一下 10250,10250实际是Kubelet的默认端口,/metrics 接口就是在这个端口暴露的,我们请求一下:
  1. [root@tt-fc-dev01.nj ~]# curl localhost:10250/metrics
  2. Client sent an HTTP request to an HTTPS server.
  3. [root@tt-fc-dev01.nj ~]# curl https://localhost:10250/metrics
  4. curl: (60) SSL certificate problem: self signed certificate in certificate chain
  5. More details here: https://curl.haxx.se/docs/sslcerts.html
  6. curl failed to verify the legitimacy of the server and therefore could not
  7. establish a secure connection to it. To learn more about this situation and
  8. how to fix it, please visit the web page mentioned above.
  9. [root@tt-fc-dev01.nj ~]# curl -k https://localhost:10250/metrics
  10. Unauthorized
复制代码
-k 表示不校验SSL证书是否正确,最后的命令可以看到返回了 Unauthorized,表示认证失败,我们先来解决一下认证问题。认证是 Kubernetes 的一个知识点,这里先不展开(你需要Google一下了解基本常识),直接实操。
认证信息

下面的信息可以保存为 auth.yaml,创建了 ClusterRole、ServiceAccount、ClusterRoleBinding。
  1. ---
  2. apiVersion: rbac.authorization.k8s.io/v1
  3. kind: ClusterRole
  4. metadata:
  5.   name: categraf-daemonset
  6. rules:
  7. - apiGroups:
  8.   - ""
  9.   resources:
  10.   - nodes/metrics
  11.   - nodes/stats
  12.   - nodes/proxy
  13.   verbs:
  14.   - get
  15. ---
  16. apiVersion: v1
  17. kind: ServiceAccount
  18. metadata:
  19.   name: categraf-daemonset
  20.   namespace: flashcat
  21. ---
  22. apiVersion: rbac.authorization.k8s.io/v1
  23. kind: ClusterRoleBinding
  24. metadata:
  25.   name: categraf-daemonset
  26. roleRef:
  27.   apiGroup: rbac.authorization.k8s.io
  28.   kind: ClusterRole
  29.   name: categraf-daemonset
  30. subjects:
  31. - kind: ServiceAccount
  32.   name: categraf-daemonset
  33.   namespace: flashcat
复制代码
ClusterRole是个全局概念,不属于任一个namespace,定义了很多权限点,都是读权限,监控嘛,读权限就可以了,ServiceAccount则是namespace颗粒度的一个概念,这里我们创建了一个名为categraf-daemonset的ServiceAccount,然后绑定到ClusterRole上面,具备了各种查询权限。apply一下即可:
  1. [work@tt-fc-dev01.nj yamls]$ kubectl apply -f auth.yaml
  2. clusterrole.rbac.authorization.k8s.io/categraf-daemonset created
  3. serviceaccount/categraf-daemonset created
  4. clusterrolebinding.rbac.authorization.k8s.io/categraf-daemonset created
  5. [work@tt-fc-dev01.nj yamls]$ kubectl get ClusterRole | grep categraf-daemon
  6. categraf-daemonset                                                     2022-11-14T03:53:54Z
  7. [work@tt-fc-dev01.nj yamls]$ kubectl get sa -n flashcat
  8. NAME                 SECRETS   AGE
  9. categraf-daemonset   1         90m
  10. default              1         4d23h
  11. [work@tt-fc-dev01.nj yamls]$ kubectl get ClusterRoleBinding -n flashcat | grep categraf-daemon
  12. categraf-daemonset ClusterRole/categraf-daemonset 91m
复制代码
测试权限

上面的命令行输出可以看出来,我们已经成功创建了 ServiceAccount,把ServiceAccount的内容打印出来看一下:
  1. [root@tt-fc-dev01.nj qinxiaohui]# kubectl get sa categraf-daemonset -n flashcat -o yaml
  2. apiVersion: v1
  3. kind: ServiceAccount
  4. metadata:
  5.   annotations:
  6.     kubectl.kubernetes.io/last-applied-configuration: |
  7.       {"apiVersion":"v1","kind":"ServiceAccount","metadata":{"annotations":{},"name":"categraf-daemonset","namespace":"flashcat"}}
  8.   creationTimestamp: "2022-11-14T03:53:54Z"
  9.   name: categraf-daemonset
  10.   namespace: flashcat
  11.   resourceVersion: "120570510"
  12.   uid: 22f5a785-871c-4454-b82e-12bf104450a0
  13. secrets:
  14. - name: categraf-daemonset-token-7mccq
复制代码
注意最后两行,这个ServiceAccount实际是关联了一个Secret,我们再看看这个Secret的内容:
  1. [root@tt-fc-dev01.nj qinxiaohui]# kubectl get secret categraf-daemonset-token-7mccq -n flashcat -o yaml
  2. apiVersion: v1
  3. data:
  4.   ca.crt: LS0tLS1CRUdJTiBDRVJUSUZJQ0FURS0tLS0tCk1JSUMvakNDQWVhZ0F3SUJBZ0lCQURBTkJna3Foa2lHOXcwQkFRc0ZBREFWTVJNd0VRWURWUVFERXdwcmRXSmwKY201bGRHVnpNQjRYRFRJeU1ERXdPVEF4TXpjek9Gb1hEVE15TURFd056QXhNemN6T0Zvd0ZURVRNQkVHQTFVRQpBeE1LYTNWaVpYSnVaWFJsY3pDQ0FTSXdEUVlKS29aSWh2Y05BUUVCQlFBRGdnRVBBRENDQVFvQ2dnRUJBS2F1Ck9wU3hHdXB0ZlNraW1zbmlONFVLWnp2b1p6akdoTks1eUVlZWFPcmptdXIwdTFVYlFHbTBRWlpMem8xVi9GV1gKVERBOUthcFRNVllyS2hBQjNCVXdqdGhCaFp1NjJVQzg5TmRNSDVzNFdmMGtMNENYZWQ3V2g2R05Md0MyQ2xKRwp3Tmp1UkZRTndxMWhNWjY4MGlaT1hLZk1NbEt6bWY4aDJWZmthREdpVHk0VzZHWE5sRlRJSFFkVFBVMHVMY3dYCmc1cUVsMkd2cklmd05JSXBOV3ZoOEJvaFhyc1pOZVNlNHhGMVFqY0R2QVE4Q0xta2J2T011UGI5bGtwalBCMmsKV055RTVtVEZCZ2NCQ3dzSGhjUHhyN0E3cXJXMmtxbU1MbUJpc2dHZm9ieXFWZy90cTYzS1oxYlRvWjBIbXhicQp6TkpOZUJpbm9jbi8xblJBK3NrQ0F3RUFBYU5aTUZjd0RnWURWUjBQQVFIL0JBUURBZ0trTUE4R0ExVWRFd0VCCi93UUZNQU1CQWY4d0hRWURWUjBPQkJZRUZLVkxrbVQ5RTNwTmp3aThsck5UdXVtRm1MWHNNQlVHQTFVZEVRUU8KTUF5Q0NtdDFZbVZ5Ym1WMFpYTXdEUVlKS29aSWh2Y05BUUVMQlFBRGdnRUJBSm5QR24rR012S1ZadFVtZVc2bQoxanY2SmYvNlBFS2JzSHRkN2dINHdwREI3YW9pQVBPeTE0bVlYL2d5WWgyZHdsRk9hTWllVS9vUFlmRDRUdGxGCkZMT08yVkdLVTJBSmFNYnVBekw4ZTlsTFREM0xLOGFJUm1FWFBhQkR2V3VUYXZuSTZCWDhiNUs4SndraVd0R24KUFh0ejZhOXZDK1BoaWZDR0phMkNxQWtJV0Nrc0lWenNJcWJ0dkEvb1pHK1dhMlduemFlMC9OUFl4QS8waldOMwpVcGtDWllFaUQ4VlUwenRIMmNRTFE4Z2Mrb21uc3ljaHNjaW5KN3JsZS9XbVFES3ZhVUxLL0xKVTU0Vm1DM2grCnZkaWZtQStlaFZVZnJaTWx6SEZRbWdzMVJGMU9VczNWWUd0REt5YW9uRkc0VFlKa1NvM0IvRlZOQ0ZtcnNHUTYKZWV3PQotLS0tLUVORCBDRVJUSUZJQ0FURS0tLS0tCg==
  5.   namespace: Zmxhc2hjYXQ=
  6.   token: ZXlKaGJHY2lPaUpTVXpJMU5pSXNJbXRwWkNJNklqRTJZVTlNU2pObFFVbEhlbmhDV1dsVmFIcEVTRlZVWVdoZlZVaDZSbmd6TUZGZlVWUjJUR0pzVUVraWZRLmV5SnBjM01pT2lKcmRXSmxjbTVsZEdWekwzTmxjblpwWTJWaFkyTnZkVzUwSWl3aWEzVmlaWEp1WlhSbGN5NXBieTl6WlhKMmFXTmxZV05qYjNWdWRDOXVZVzFsYzNCaFkyVWlPaUptYkdGemFHTmhkQ0lzSW10MVltVnlibVYwWlhNdWFXOHZjMlZ5ZG1salpXRmpZMjkxYm5RdmMyVmpjbVYwTG01aGJXVWlPaUpqWVhSbFozSmhaaTFrWVdWdGIyNXpaWFF0ZEc5clpXNHROMjFqWTNFaUxDSnJkV0psY201bGRHVnpMbWx2TDNObGNuWnBZMlZoWTJOdmRXNTBMM05sY25acFkyVXRZV05qYjNWdWRDNXVZVzFsSWpvaVkyRjBaV2R5WVdZdFpHRmxiVzl1YzJWMElpd2lhM1ZpWlhKdVpYUmxjeTVwYnk5elpYSjJhV05sWVdOamIzVnVkQzl6WlhKMmFXTmxMV0ZqWTI5MWJuUXVkV2xrSWpvaU1qSm1OV0UzT0RVdE9EY3hZeTAwTkRVMExXSTRNbVV0TVRKaVpqRXdORFExTUdFd0lpd2ljM1ZpSWpvaWMzbHpkR1Z0T25ObGNuWnBZMlZoWTJOdmRXNTBPbVpzWVhOb1kyRjBPbU5oZEdWbmNtRm1MV1JoWlcxdmJuTmxkQ0o5Lm03czJ2Z1JuZDJzMDJOUkVwakdpc0JYLVBiQjBiRjdTRUFqb2RjSk9KLWh6YWhzZU5FSDFjNGNDbXotMDN5Z1Rkal9NT1VKaWpCalRmaW9FSWpGZHRCS0hEMnNjNXlkbDIwbjU4VTBSVXVDemRYQl9tY0J1WDlWWFM2bE5zYVAxSXNMSGdscV9Sbm5XcDZaNmlCaWp6SU05QUNuckY3MGYtd1FZTkVLc2MzdGhubmhSX3E5MkdkZnhmdGU2NmhTRGthdGhPVFRuNmJ3ZnZMYVMxV1JCdEZ4WUlwdkJmVXpkQ1FBNVhRYVNPck00RFluTE5uVzAxWDNqUGVZSW5ka3NaQ256cmV6Tnp2OEt5VFRTSlJ2VHVKMlZOU2lHaDhxTEgyZ3IzenhtQm5Qb1d0czdYeFhBTkJadG0yd0E2OE5FXzY0SlVYS0tfTlhfYmxBbFViakwtUQ==
  7. kind: Secret
  8. metadata:
  9.   annotations:
  10.     kubernetes.io/service-account.name: categraf-daemonset
  11.     kubernetes.io/service-account.uid: 22f5a785-871c-4454-b82e-12bf104450a0
  12.   creationTimestamp: "2022-11-14T03:53:54Z"
  13.   name: categraf-daemonset-token-7mccq
  14.   namespace: flashcat
  15.   resourceVersion: "120570509"
  16.   uid: 0a228da5-6e60-4b22-beff-65cc56683e41
  17. type: kubernetes.io/service-account-token
复制代码
我们把这个token字段拿到,然后base64转码一下,作为Bearer Token来请求测试一下:
  1. [root@tt-fc-dev01.nj qinxiaohui]# token=`kubectl get secret categraf-daemonset-token-7mccq -n flashcat -o jsonpath={.data.token} | base64 -d`
  2. [root@tt-fc-dev01.nj qinxiaohui]# curl -s -k -H "Authorization: Bearer $token" https://localhost:10250/metrics > aaaa
  3. [root@tt-fc-dev01.nj qinxiaohui]# head -n 5 aaaa
  4. # HELP apiserver_audit_event_total [ALPHA] Counter of audit events generated and sent to the audit backend.
  5. # TYPE apiserver_audit_event_total counter
  6. apiserver_audit_event_total 0
  7. # HELP apiserver_audit_requests_rejected_total [ALPHA] Counter of apiserver requests rejected due to an error in audit logging backend.
  8. # TYPE apiserver_audit_requests_rejected_total counter
  9. apiserver_audit_requests_rejected_total 0
复制代码
通了!
这就说明我们创建的ServiceAccount是好使的,后面我们把 Categraf 作为采集器搞成 Daemonset,再为 Categraf 这个 Daemonset 指定 ServiceAccountName,Kubernetes就会自动把 Token 的内容挂到 Daemonset 的目录里,下面开始实操。
升级 Daemonset

上一篇咱们为 Kube-Proxy 的采集准备了 Daemonset,咱们就继续修改这个 Daemonset,让这个 Daemonset 不但可以采集 Kube-Proxy,也可以采集 Kubelet,先给 Categraf 准备一下相关的配置,可以把下面的内容保存为 categraf-configmap-v2.yaml
  1. ---
  2. kind: ConfigMap
  3. metadata:
  4.   name: categraf-config
  5. apiVersion: v1
  6. data:
  7.   config.toml: |
  8.     [global]
  9.     hostname = "$HOSTNAME"
  10.     interval = 15
  11.     providers = ["local"]
  12.     [writer_opt]
  13.     batch = 2000
  14.     chan_size = 10000
  15.     [[writers]]
  16.     url = "http://10.206.0.16:19000/prometheus/v1/write"
  17.     timeout = 5000
  18.     dial_timeout = 2500
  19.     max_idle_conns_per_host = 100   
  20. ---
  21. kind: ConfigMap
  22. metadata:
  23.   name: categraf-input-prometheus
  24. apiVersion: v1
  25. data:
  26.   prometheus.toml: |
  27.     [[instances]]
  28.     urls = ["http://127.0.0.1:10249/metrics"]
  29.     labels = { job="kube-proxy" }
  30.     [[instances]]
  31.     urls = ["https://127.0.0.1:10250/metrics"]
  32.     bearer_token_file = "/var/run/secrets/kubernetes.io/serviceaccount/token"
  33.     use_tls = true
  34.     insecure_skip_verify = true
  35.     labels = { job="kubelet" }
  36.     [[instances]]
  37.     urls = ["https://127.0.0.1:10250/metrics/cadvisor"]
  38.     bearer_token_file = "/var/run/secrets/kubernetes.io/serviceaccount/token"
  39.     use_tls = true
  40.     insecure_skip_verify = true
  41.     labels = { job="cadvisor" }   
复制代码
apply 一下,让新的配置生效:
  1. [work@tt-fc-dev01.nj yamls]$ kubectl apply -f categraf-configmap-v2.yaml -n flashcat
  2. configmap/categraf-config unchanged
  3. configmap/categraf-input-prometheus configured
复制代码
Categraf 的 Daemonset 需要把 ServiceAccountName 给绑定上,上一讲咱们用的 yaml 命名为:categraf-daemonset-v1.yaml ,咱们升级一下这个文件到 categraf-daemonset-v2.yaml 版本,内容如下:
  1. apiVersion: apps/v1
  2. kind: DaemonSet
  3. metadata:
  4.   labels:
  5.     app: categraf-daemonset
  6.   name: categraf-daemonset
  7. spec:
  8.   selector:
  9.     matchLabels:
  10.       app: categraf-daemonset
  11.   template:
  12.     metadata:
  13.       labels:
  14.         app: categraf-daemonset
  15.     spec:
  16.       containers:
  17.       - env:
  18.         - name: TZ
  19.           value: Asia/Shanghai
  20.         - name: HOSTNAME
  21.           valueFrom:
  22.             fieldRef:
  23.               apiVersion: v1
  24.               fieldPath: spec.nodeName
  25.         - name: HOSTIP
  26.           valueFrom:
  27.             fieldRef:
  28.               apiVersion: v1
  29.               fieldPath: status.hostIP
  30.         image: flashcatcloud/categraf:v0.2.18
  31.         imagePullPolicy: IfNotPresent
  32.         name: categraf
  33.         volumeMounts:
  34.         - mountPath: /etc/categraf/conf
  35.           name: categraf-config
  36.         - mountPath: /etc/categraf/conf/input.prometheus
  37.           name: categraf-input-prometheus
  38.       hostNetwork: true
  39.       serviceAccountName: categraf-daemonset
  40.       restartPolicy: Always
  41.       tolerations:
  42.       - effect: NoSchedule
  43.         operator: Exists
  44.       volumes:
  45.       - configMap:
  46.           name: categraf-config
  47.         name: categraf-config
  48.       - configMap:
  49.           name: categraf-input-prometheus
  50.         name: categraf-input-prometheus
复制代码
这里跟 v1 版本相比,唯一的变化,就是加了 serviceAccountName: categraf-daemonset 这个配置,把原来的 Daemonset 删掉,从新创建一下:
  1. [work@tt-fc-dev01.nj yamls]$ kubectl delete ds categraf-daemonset -n flashcat
  2. daemonset.apps "categraf-daemonset" deleted
  3. [work@tt-fc-dev01.nj yamls]$ kubectl apply -f categraf-daemonset-v2.yaml -n flashcat
  4. daemonset.apps/categraf-daemonset created
  5. # waiting...
  6. [work@tt-fc-dev01.nj yamls]$ kubectl get pods -n flashcat
  7. NAME                       READY   STATUS    RESTARTS   AGE
  8. categraf-daemonset-d8jt8   1/1     Running   0          37s
  9. categraf-daemonset-fpx8v   1/1     Running   0          43s
  10. categraf-daemonset-mp468   1/1     Running   0          32s
  11. categraf-daemonset-s775l   1/1     Running   0          40s
  12. categraf-daemonset-wxkjk   1/1     Running   0          47s
  13. categraf-daemonset-zwscc   1/1     Running   0          35s
复制代码
好了,我们去检查一下数据是否成功采集上来了:

上面这个指标是 Kubelet 自身的,即从 Kubelet 的 /metrics 接口采集的,我们再来看一个 cAdvisor 的,即从 /metrics/cadvisor 接口采集的:

看起来数据都上来了,导入监控大盘看看效果。
导入仪表盘

分成两部分,一个是 Kubelet 自身的仪表盘,JSON配置在这里,截图效果如下:

另外一个是Pod容器相关的大盘,JSON配置在这里(感谢张健老师悉心整理)
监控指标说明

之前孔飞老师整理的 Kubelet 相关指标的中文解释,我也一并附到这里,供大家参考:
  1. # HELP go_gc_duration_seconds A summary of the pause duration of garbage collection cycles.
  2. # TYPE go_gc_duration_seconds summary
  3. gc的时间统计(summary指标)
  4. # HELP go_goroutines Number of goroutines that currently exist.
  5. # TYPE go_goroutines gauge
  6. goroutine 数量
  7. # HELP go_threads Number of OS threads created.
  8. # TYPE go_threads gauge
  9. 线程数量
  10. # HELP kubelet_cgroup_manager_duration_seconds [ALPHA] Duration in seconds for cgroup manager operations. Broken down by method.
  11. # TYPE kubelet_cgroup_manager_duration_seconds histogram
  12. 操作cgroup的时长分布,按照操作类型统计
  13. # HELP kubelet_containers_per_pod_count [ALPHA] The number of containers per pod.
  14. # TYPE kubelet_containers_per_pod_count histogram
  15. pod中container数量的统计(spec.containers的数量)
  16. # HELP kubelet_docker_operations_duration_seconds [ALPHA] Latency in seconds of Docker operations. Broken down by operation type.
  17. # TYPE kubelet_docker_operations_duration_seconds histogram
  18. 操作docker的时长分布,按照操作类型统计
  19. # HELP kubelet_docker_operations_errors_total [ALPHA] Cumulative number of Docker operation errors by operation type.
  20. # TYPE kubelet_docker_operations_errors_total counter
  21. 操作docker的错误累计次数,按照操作类型统计
  22. # HELP kubelet_docker_operations_timeout_total [ALPHA] Cumulative number of Docker operation timeout by operation type.
  23. # TYPE kubelet_docker_operations_timeout_total counter
  24. 操作docker的超时统计,按照操作类型统计
  25. # HELP kubelet_docker_operations_total [ALPHA] Cumulative number of Docker operations by operation type.
  26. # TYPE kubelet_docker_operations_total counter
  27. 操作docker的累计次数,按照操作类型统计
  28. # HELP kubelet_eviction_stats_age_seconds [ALPHA] Time between when stats are collected, and when pod is evicted based on those stats by eviction signal
  29. # TYPE kubelet_eviction_stats_age_seconds histogram
  30. 驱逐操作的时间分布,按照驱逐信号(原因)分类统计
  31. # HELP kubelet_evictions [ALPHA] Cumulative number of pod evictions by eviction signal
  32. # TYPE kubelet_evictions counter
  33. 驱逐次数统计,按照驱逐信号(原因)统计
  34. # HELP kubelet_http_inflight_requests [ALPHA] Number of the inflight http requests
  35. # TYPE kubelet_http_inflight_requests gauge
  36. 请求kubelet的inflight请求数,按照method path server_type统计, 注意与每秒的request数区别开
  37. # HELP kubelet_http_requests_duration_seconds [ALPHA] Duration in seconds to serve http requests
  38. # TYPE kubelet_http_requests_duration_seconds histogram
  39. 请求kubelet的请求时间统计, 按照method path server_type统计
  40. # HELP kubelet_http_requests_total [ALPHA] Number of the http requests received since the server started
  41. # TYPE kubelet_http_requests_total counter
  42. 请求kubelet的请求数统计,按照method path server_type统计
  43. # HELP kubelet_managed_ephemeral_containers [ALPHA] Current number of ephemeral containers in pods managed by this kubelet. Ephemeral containers will be ignored if disabled by the EphemeralContainers feature gate, and this number will be 0.
  44. # TYPE kubelet_managed_ephemeral_containers gauge
  45. 当前kubelet管理的临时容器数量
  46. # HELP kubelet_network_plugin_operations_duration_seconds [ALPHA] Latency in seconds of network plugin operations. Broken down by operation type.
  47. # TYPE kubelet_network_plugin_operations_duration_seconds histogram
  48. 网络插件的操作耗时分布 ,按照操作类型(operation_type)统计, 如果 --feature-gates=EphemeralContainers=false, 否则一直为0
  49. # HELP kubelet_network_plugin_operations_errors_total [ALPHA] Cumulative number of network plugin operation errors by operation type.
  50. # TYPE kubelet_network_plugin_operations_errors_total counter
  51. 网络插件累计操作错误数统计,按照操作类型(operation_type)统计
  52. # HELP kubelet_network_plugin_operations_total [ALPHA] Cumulative number of network plugin operations by operation type.
  53. # TYPE kubelet_network_plugin_operations_total counter
  54. 网络插件累计操作数统计,按照操作类型(operation_type)统计
  55. # HELP kubelet_node_name [ALPHA] The node's name. The count is always 1.
  56. # TYPE kubelet_node_name gauge
  57. node name
  58. # HELP kubelet_pleg_discard_events [ALPHA] The number of discard events in PLEG.
  59. # TYPE kubelet_pleg_discard_events counter
  60. PLEG(pod lifecycle event generator) 丢弃的event数统计
  61. # HELP kubelet_pleg_last_seen_seconds [ALPHA] Timestamp in seconds when PLEG was last seen active.
  62. # TYPE kubelet_pleg_last_seen_seconds gauge
  63. PLEG上次活跃的时间戳
  64. # HELP kubelet_pleg_relist_duration_seconds [ALPHA] Duration in seconds for relisting pods in PLEG.
  65. # TYPE kubelet_pleg_relist_duration_seconds histogram
  66. PLEG relist pod时间分布
  67. # HELP kubelet_pleg_relist_interval_seconds [ALPHA] Interval in seconds between relisting in PLEG.
  68. # TYPE kubelet_pleg_relist_interval_seconds histogram
  69. PLEG relist 间隔时间分布
  70. # HELP kubelet_pod_start_duration_seconds [ALPHA] Duration in seconds for a single pod to go from pending to running.
  71. # TYPE kubelet_pod_start_duration_seconds histogram
  72. pod启动时间(从pending到running)分布, kubelet watch到pod时到pod中contianer都running后, watch各种source channel的pod变更
  73. # HELP kubelet_pod_worker_duration_seconds [ALPHA] Duration in seconds to sync a single pod. Broken down by operation type: create, update, or sync
  74. # TYPE kubelet_pod_worker_duration_seconds histogram
  75. pod状态变化的时间分布, 按照操作类型(create update sync)统计, worker就是kubelet中处理一个pod的逻辑工作单位
  76. # HELP kubelet_pod_worker_start_duration_seconds [ALPHA] Duration in seconds from seeing a pod to starting a worker.
  77. # TYPE kubelet_pod_worker_start_duration_seconds histogram
  78. kubelet watch到pod到worker启动的时间分布
  79. # HELP kubelet_run_podsandbox_duration_seconds [ALPHA] Duration in seconds of the run_podsandbox operations. Broken down by RuntimeClass.Handler.
  80. # TYPE kubelet_run_podsandbox_duration_seconds histogram
  81. 启动sandbox的时间分布
  82. # HELP kubelet_run_podsandbox_errors_total [ALPHA] Cumulative number of the run_podsandbox operation errors by RuntimeClass.Handler.
  83. # TYPE kubelet_run_podsandbox_errors_total counter
  84. 启动sanbox出现error的总数
  85. # HELP kubelet_running_containers [ALPHA] Number of containers currently running
  86. # TYPE kubelet_running_containers gauge
  87. 当前containers运行状态的统计, 按照container状态统计,created running exited
  88. # HELP kubelet_running_pods [ALPHA] Number of pods that have a running pod sandbox
  89. # TYPE kubelet_running_pods gauge
  90. 当前处于running状态pod数量
  91. # HELP kubelet_runtime_operations_duration_seconds [ALPHA] Duration in seconds of runtime operations. Broken down by operation type.
  92. # TYPE kubelet_runtime_operations_duration_seconds histogram
  93. 容器运行时的操作耗时(container在create list exec remove stop等的耗时)
  94. # HELP kubelet_runtime_operations_errors_total [ALPHA] Cumulative number of runtime operation errors by operation type.
  95. # TYPE kubelet_runtime_operations_errors_total counter
  96. 容器运行时的操作错误数统计(按操作类型统计)
  97. # HELP kubelet_runtime_operations_total [ALPHA] Cumulative number of runtime operations by operation type.
  98. # TYPE kubelet_runtime_operations_total counter
  99. 容器运行时的操作总数统计(按操作类型统计)
  100. # HELP kubelet_started_containers_errors_total [ALPHA] Cumulative number of errors when starting containers
  101. # TYPE kubelet_started_containers_errors_total counter
  102. kubelet启动容器错误总数统计(按code和container_type统计)
  103. code包括ErrImagePull ErrImageInspect ErrImagePull ErrRegistryUnavailable ErrInvalidImageName等
  104. container_type一般为"container" "podsandbox"
  105. # HELP kubelet_started_containers_total [ALPHA] Cumulative number of containers started
  106. # TYPE kubelet_started_containers_total counter
  107. kubelet启动容器总数
  108. # HELP kubelet_started_pods_errors_total [ALPHA] Cumulative number of errors when starting pods
  109. # TYPE kubelet_started_pods_errors_total counter
  110. kubelet启动pod遇到的错误总数(只有创建sandbox遇到错误才会统计)
  111. # HELP kubelet_started_pods_total [ALPHA] Cumulative number of pods started
  112. # TYPE kubelet_started_pods_total counter
  113. kubelet启动的pod总数
  114. # HELP process_cpu_seconds_total Total user and system CPU time spent in seconds.
  115. # TYPE process_cpu_seconds_total counter
  116. 统计cpu使用率
  117. # HELP process_max_fds Maximum number of open file descriptors.
  118. # TYPE process_max_fds gauge
  119. 允许进程打开的最大fd数
  120. # HELP process_open_fds Number of open file descriptors.
  121. # TYPE process_open_fds gauge
  122. 当前打开的fd数量
  123. # HELP process_resident_memory_bytes Resident memory size in bytes.
  124. # TYPE process_resident_memory_bytes gauge
  125. 进程驻留内存大小
  126. # HELP process_start_time_seconds Start time of the process since unix epoch in seconds.
  127. # TYPE process_start_time_seconds gauge
  128. 进程启动时间
  129. # HELP rest_client_request_duration_seconds [ALPHA] Request latency in seconds. Broken down by verb and URL.
  130. # TYPE rest_client_request_duration_seconds histogram
  131. 请求apiserver的耗时统计(按照url和请求类型统计verb)
  132. # HELP rest_client_requests_total [ALPHA] Number of HTTP requests, partitioned by status code, method, and host.
  133. # TYPE rest_client_requests_total counter
  134. 请求apiserver的总次数(按照返回码code和请求类型method统计)
  135. # HELP storage_operation_duration_seconds [ALPHA] Storage operation duration
  136. # TYPE storage_operation_duration_seconds histogram
  137. 存储操作耗时(按照存储plugin(configmap emptydir hostpath 等 )和operation_name分类统计)
  138. # HELP volume_manager_total_volumes [ALPHA] Number of volumes in Volume Manager
  139. # TYPE volume_manager_total_volumes gauge
  140. 本机挂载的volume数量统计(按照plugin_name和state统计
  141. plugin_name包括"host-path" "empty-dir" "configmap" "projected")
  142. state(desired_state_of_world期状态/actual_state_of_world实际状态)
复制代码
下面是 cAdvisor 指标梳理:
  1. # HELP container_cpu_cfs_periods_total Number of elapsed enforcement period intervals.
  2. # TYPE container_cpu_cfs_periods_total counter
  3. cfs时间片总数, 完全公平调度的时间片总数(分配到cpu的时间片数)
  4. # HELP container_cpu_cfs_throttled_periods_total Number of throttled period intervals.
  5. # TYPE container_cpu_cfs_throttled_periods_total counter
  6. 容器被throttle的时间片总数
  7. # HELP container_cpu_cfs_throttled_seconds_total Total time duration the container has been throttled.
  8. # TYPE container_cpu_cfs_throttled_seconds_total counter
  9. 容器被throttle的时间
  10. # HELP container_file_descriptors Number of open file descriptors for the container.
  11. # TYPE container_file_descriptors gauge
  12. 容器打开的fd数
  13. # HELP container_memory_usage_bytes Current memory usage in bytes, including all memory regardless of when it was accessed
  14. # TYPE container_memory_usage_bytes gauge
  15. 容器内存使用量,单位byte
  16. # HELP container_network_receive_bytes_total Cumulative count of bytes received
  17. # TYPE container_network_receive_bytes_total counter
  18. 容器入方向的流量
  19. # HELP container_network_transmit_bytes_total Cumulative count of bytes transmitted
  20. # TYPE container_network_transmit_bytes_total counter
  21. 容器出方向的流量
  22. # HELP container_spec_cpu_period CPU period of the container.
  23. # TYPE container_spec_cpu_period gauge
  24. 容器的cpu调度单位时间
  25. # HELP container_spec_cpu_quota CPU quota of the container.
  26. # TYPE container_spec_cpu_quota gauge
  27. 容器的cpu规格 ,除以单位调度时间可以计算核数
  28. # HELP container_spec_memory_limit_bytes Memory limit for the container.
  29. # TYPE container_spec_memory_limit_bytes gauge
  30. 容器的内存规格,单位byte
  31. # HELP container_threads Number of threads running inside the container
  32. # TYPE container_threads gauge
  33. 容器当前的线程数
  34. # HELP container_threads_max Maximum number of threads allowed inside the container, infinity if value is zero
  35. # TYPE container_threads_max gauge
  36. 允许容器启动的最大线程数
复制代码
相关文章

关于作者

本文作者秦晓辉、孔飞,快猫星云监控技术爱好者,文章内容是快猫技术团队共同沉淀的结晶,作者做了编辑整理,我们会持续输出监控、稳定性保障相关的技术文章,文章可转载,转载请注明出处,尊重技术人员的成果。

免责声明:如果侵犯了您的权益,请联系站长,我们会及时删除侵权内容,谢谢合作!

本帖子中包含更多资源

您需要 登录 才可以下载或查看,没有账号?立即注册

x
回复

使用道具 举报

0 个回复

倒序浏览

快速回复

您需要登录后才可以回帖 登录 or 立即注册

本版积分规则

祗疼妳一个

金牌会员
这个人很懒什么都没写!

标签云

快速回复 返回顶部 返回列表