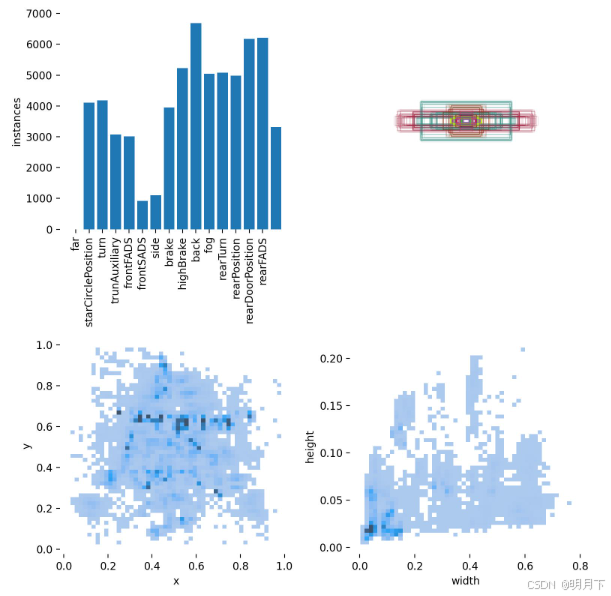
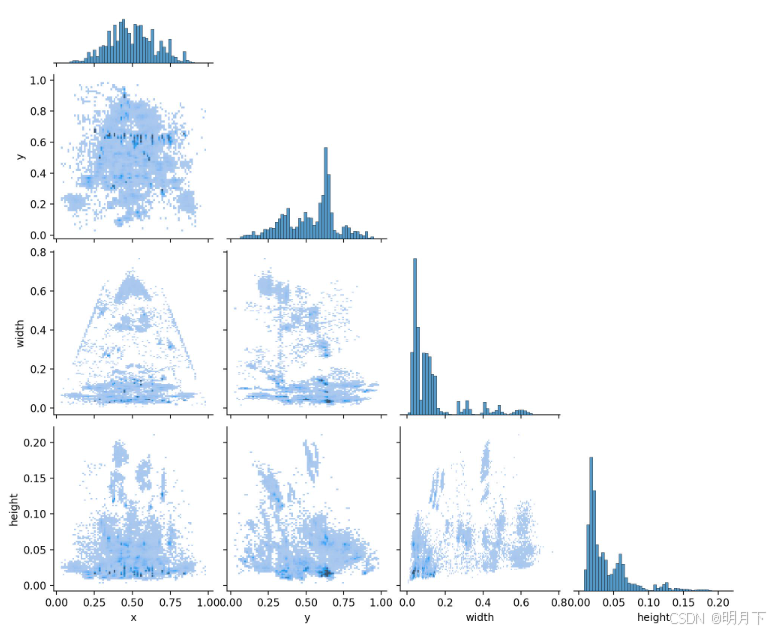
yolo的数据可视化很详细,coco格式没有。所以写了一个接口。
输入:coco格式的instances.json
输出:生成像yolo那样的标注文件统计并可视化
- import os
- import random
- import numpy as np
- import pandas as pd
- import matplotlib
- import matplotlib.pyplot as plt
- import seaborn as sn
- from glob import glob
- from PIL import Image, ImageDraw
- import json
- """
- 功能:
- 读取instances.json
- 生成像yolo那样的标注文件统计并可视化
-
- """
- def convert(size, box):
- # size(img_width, img_height)
- # box=[x_min, y_min, width, height]
- # coco转yolo
- dw = 1. / (size[0])
- dh = 1. / (size[1])
- x = box[0] + box[2] / 2.0
- y = box[1] + box[3] / 2.0
- w = box[2]
- h = box[3]
- #round函数确定(xmin, ymin, xmax, ymax)的小数位数
- x = round(x * dw, 6)
- w = round(w * dw, 6)
- y = round(y * dh, 6)
- h = round(h * dh, 6)
- return (x, y, w, h)
- def plot_labels(labels, names=(), save_dir='',colors=[0,0,255]):
- # plot dataset labels
- print('Plotting labels... ')
- c, b = labels[:, 0], labels[:, 1:].transpose() # classes, boxes
- nc = int(c.max() + 1) # number of classes
- x = pd.DataFrame(b.transpose(), columns=['x', 'y', 'width', 'height'])
- # seaborn correlogram
- sn.pairplot(x, corner=True, diag_kind='auto', kind='hist', diag_kws=dict(bins=50), plot_kws=dict(pmax=0.9))
- plt.savefig(os.path.join(save_dir, 'labels_correlogram.jpg'), dpi=200)
- plt.close()
- # matplotlib labels
- matplotlib.use('svg') # faster
- ax = plt.subplots(2, 2, figsize=(8, 8), tight_layout=True)[1].ravel()
- y = ax[0].hist(c, bins=np.linspace(0, nc, nc + 1) - 0.5, rwidth=0.8)
- # [y[2].patches[i].set_color([x / 255 for x in colors(i)]) for i in range(nc)] # update colors bug #3195
- ax[0].set_ylabel('instances')
- if 0 < len(names) < 30:
- ax[0].set_xticks(range(len(names)))
- ax[0].set_xticklabels(names, rotation=90, fontsize=10)
- else:
- ax[0].set_xlabel('classes')
- sn.histplot(x, x='x', y='y', ax=ax[2], bins=50, pmax=0.9)
- sn.histplot(x, x='width', y='height', ax=ax[3], bins=50, pmax=0.9)
- # rectangles
- labels[:, 1:3] = 0.5 # center
- labels[:, 1:] = xywh2xyxy(labels[:, 1:]) * 2000
- img = Image.fromarray(np.ones((2000, 2000, 3), dtype=np.uint8) * 255)
- for cls, *box in labels[:1000]:
- ImageDraw.Draw(img).rectangle(box, width=1, outline=colors[int(cls)-1]) # plot
- ax[1].imshow(img)
- ax[1].axis('off')
- for a in [0, 1, 2, 3]:
- for s in ['top', 'right', 'left', 'bottom']:
- ax[a].spines[s].set_visible(False)
- plt.savefig(os.path.join(save_dir, 'labels.jpg'), dpi=200)
- matplotlib.use('Agg')
- plt.close()
- def xywh2xyxy(x):
- # Convert nx4 boxes from [x, y, w, h] to [x1, y1, x2, y2] where xy1=top-left, xy2=bottom-right
- y = np.copy(x)
- y[:, 0] = x[:, 0] - x[:, 2] / 2 # top left x
- y[:, 1] = x[:, 1] - x[:, 3] / 2 # top left y
- y[:, 2] = x[:, 0] + x[:, 2] / 2 # bottom right x
- y[:, 3] = x[:, 1] + x[:, 3] / 2 # bottom right y
- return y
- def main(json_name,save_root,data_name):
-
- # 获取当前数据集中所有json文件
-
- with open(json_name, 'r', encoding='utf-8') as file:
- result = json.load(file)
- # 每个类别一个颜色
- category=[]
- for i in result['categories']:
- category.append(i['name'])# 类别
- num_classes = len(category) # 类别数
- colors = [(random.randint(0,255),random.randint(0,255),random.randint(0,255)) for _ in range(num_classes)] # 每个类别生成一个随机颜色
- # 统计标注信息
- shapes = [] # 标注框
- ids = [] # 类别名的索引
- for i in result['annotations']:
- img_height=result['images'][i['image_id']-1]['height']
- img_width=result['images'][i['image_id']-1]['width']
- label_id=i['category_id']
- ids.append([label_id])
- (x, y, w, h)=convert([img_width, img_height], i['bbox'])
- shapes.append([x, y, w, h])
- shapes = np.array(shapes)
- ids = np.array(ids)
- lbs = np.hstack((ids, shapes))
- plot_labels(labels=lbs, names=np.array(category),save_dir=os.path.join(save_root,data_name),colors=colors)
- print("可视化已保存:", os.path.join(save_root,data_name, "label.jpg"))
- if __name__ == "__main__":
- json_name = os.path.join(path,data_name,'annotations','instances.json')
- save_root='保存路径'
- data_name='数据集的名称'
- main(json_name,save_root,data_name)

labels_correlogram.jpg

免责声明:如果侵犯了您的权益,请联系站长,我们会及时删除侵权内容,谢谢合作!更多信息从访问主页:qidao123.com:ToB企服之家,中国第一个企服评测及商务社交产业平台。 |